Candlestick Patterns for Successful Option Trading
What is a Candle Stick Pattern?
An essential component of any option trader's toolbox is candlestick patterns. These patterns give traders insightful information about market sentiment that they can use to forecast price changes and make wise trading choices.
We'll go into the world of candlestick patterns in this blog, looking at their types, significance, and how option traders may use them to improve their trading tactics.
I. Understanding Candlestick Patterns:
Candlestick patterns are visual representations of price movements within a specific timeframe. Each candlestick consists of four components: the opening price, closing price, high price, and low price. The body of the candlestick is determined by the difference between the opening and closing prices, while the shadows (wicks) represent the high and low prices.
II. Common Candlestick Patterns:
Candlestick patterns are visual representations of price movements within a specific timeframe. Each candlestick consists of four components: the opening price, closing price, high price, and low price. The body of the candlestick is determined by the difference between the opening and closing prices, while the shadows (wicks) represent the high and low prices.
1. Doji:-
A doji is created when the starting and closing prices are almost similar, signifying market hesitation. This pattern is frequently seen by traders as a possible reversal signal, especially when it emerges following a significant price movement.
The Doji pattern shows that there was a standoff in the market since neither buyers nor sellers were able to take the initiative throughout the trading session.
Depending on the context in which it appears, it implies ambiguity and the possibility of reversal or continuation. The Doji is especially important following a trend since it might indicate a probable trend reversal.
- Long-Legged Doji: Doji with extended upper and lower shadows, or "long-legged" Doji, denotes extreme volatility and significant indecision.
- Dragonfly Doji: A dragonfly Doji indicates that prices fell dramatically during the session but then rose at the close. It has a long lower shadow but no upper shadow.
- Gravestone Doji:When a Doji has a long upper shadow but no lower shadow, it is known as a "gravestone Doji," which means that prices gained strongly during the session but dropped by the close.
- Four-Price Doji: A cross-shaped Doji with equal values at the open, high, low, and close.
- After an extended uptrend or slump, a Doji may indicate a potential reversal.
- If a Doji appears within a trading range, the range may persist.
- Before responding on a Doji signal, it is common practice to look for confirmation from other technical indications or patterns.
- A string of Dojis could be a sign of a waiting time before a potential breakout or breakdown.
2. Bullish Engulfing Pattern and Bearish Engulfing Pattern:
a. Bullish Engulfing Pattern:
A larger bullish candle that totally engulfs the previous one follows a smaller bearish candle to form a bullish engulfing pattern. As buyers outnumber sellers, it implies a probable upward reversal.
- Bearish Candlestick: The first candlestick is a relatively larger bearish (red or black) candlestick. It indicates that selling pressure is still present in the market.
- Bullish Candlestick: The second candlestick is a smaller bullish (green or white) candlestick that "engulfs" the entire real body of the previous bearish candlestick. This means that the open and close of the second candlestick are both below the open and close of the first candlestick. The bullish candlestick's real body is typically larger than the bearish candlestick's real body.
- The larger the second bullish candlestick and the more pronounced the engulfing, the stronger the bullish signal.
- The pattern is more reliable when it forms after a prolonged downtrend.
- Traders often look for additional confirmation through other technical indicators or patterns before making trading decisions based solely on the Bullish Engulfing Pattern.
- As with any candlestick pattern, it's important to consider other factors such as volume, trendlines, and support/resistance levels before making trading decisions.
- False signals can occur, so prudent risk management is essential.
b. Bearish Engulfing Pattern:
Similar to the bullish engulfing pattern, the bearish engulfing pattern happens during a downtrend and denotes a possible downward reversal by involving a larger negative candle enveloping the previous bullish candle.
- Bullish Candle Stick: The first candlestick is a bullish (green or white) candlestick that is considerably smaller. It suggests that there is still market buying pressure.
- Bearish Candlestick: The subsequent candlestick, which is larger and bearish (red or black), "engulfs" the prior bullish candlestick's complete true body. This indicates that the second candlestick's open and closure are both above the first candlestick's open and close. Usually, the true body of the bearish candlestick is larger than the real body of the bullish candlestick.
The Bearish Engulfing Pattern denotes a change in the bullish to negative mindset of the market. It shows that sellers are in charge and have outweighed the purchasing pressure from the prior session. This abrupt change frequently indicates that a reversal or at the very least a correction may be in progress.
- The strength of the bearish signal increases with the size of the second bearish candlestick and the degree of the engulfing.
- When the pattern develops following a protracted rise, it is more trustworthy.
- Before placing trades based purely on the Bearish Engulfing Pattern, traders frequently seek out further confirmation via other technical indicators or patterns.
- Before making trading decisions, as with every candlestick pattern, it's crucial to take into account additional elements including volume, trendlines, and support and resistance levels.
- Since false signals can happen, careful risk management is crucial.
3. Hammer and Hanging Man:
a. Hammer:
Following a downtrend, the Hammer candlestick pattern indicates a potential trend reversal. Typically, this pattern consists of a single candlestick with the traits listed below:
- A small real body, which can be bullish or bearish.
- A long lower shadow (wick) that is at least twice the length of the real body.
- A very short or nonexistent upper shadow.
- A small real body, which can be bullish or bearish.
- A long lower shadow that is at least twice the length of the real body.
- A very short or nonexistent upper shadow.
4. Morning Star and Evening Star:
a. Morning Star:
The Morning Star is a bullish reversal candlestick pattern that suggests that a downtrend may be about to turn up. Three candlesticks usually make up this pattern:
- Bearish Candlestick: The first candlestick is a bearish (red or black) candlestick that is relatively long and denotes a significant downward movement.
- Small Candlestick: The second candlestick, which gaps down from the previous candle, is a smaller candlestick with a small genuine body (which may be bullish or bearish). This thin actual body suggests uncertainty and a possible slowing of the negative momentum.
- Bullish Candlestick: The third candlestick closes well above the body's midpoint of the first candlestick and is a bullish (green or white) candlestick. This robust bullish candle indicates that buyers have taken the initiative, which could lead the trend reversal.
- Bullish Candlestick: The first candlestick is a bullish (green or white) candlestick that is relatively long and denotes a significant upward trend.
- Small Candlestick: The second candlestick, which gaps up from the previous candle, is a smaller candlestick with a small genuine body (which may be bullish or bearish). This thin actual body suggests uncertainty and a possible slowing of the bullish momentum.
- Bearish Candlestick: The third candlestick closes far below the body's midpoint of the first candlestick and is a bearish (red or black) candlestick. This potently trend-reversing bearish candle implies that sellers have taken the initiative.
5. Three White Soldiers and Three Black Crows:
a. Three White Soldiers:
The Three White Soldiers is a bullish reversal candlestick pattern that frequently denotes the possibility of a trend change from a downtrend to an uptrend. Three consecutive bullish (green or white) candlesticks with the following traits make up this pattern:
- Each candlestick opens within the real body of the previous candle.
- Each candlestick closes higher than the previous candle's close.
- Each candlestick has a relatively small or nonexistent upper shadow.
- The pattern indicates increasing buying pressure and a possible shift in market sentiment from bearish to bullish.
- Each candlestick opens within the real body of the previous candle.
- Each candlestick closes lower than the previous candle's close.
- Each candlestick has a relatively small or nonexistent lower shadow.
- The pattern indicates increasing selling pressure and a possible shift in market sentiment from bullish to bearish.
6. Shooting Star and Inverted Hammer:
a. Shooting Star:
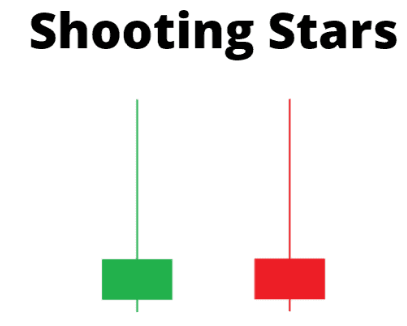
A bearish reversal candlestick pattern called the Shooting Star develops after an uptrend. It suggests a possible weakening of the upward momentum and a potential downward trend reversal. A single candlestick with the following features makes up the pattern:
- The upper shadow is relatively long and at least two times the length of the real body.
- The real body is small and located at the lower end of the price range.
- The real body can be bullish or bearish, but a bearish real body strengthens the pattern's bearish signal.
- The lower shadow, if it exists, is usually very short or nonexistent.
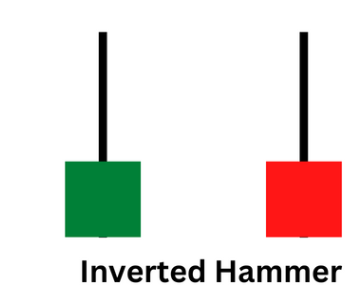
- The upper shadow is relatively small or nonexistent.
- The lower shadow is relatively long and at least two times the length of the real body.
- The real body is small and located at the upper end of the price range.
- The real body can be bullish or bearish, but a bullish real body strengthens the pattern's bullish signal.
- Long Real Body: The real body of a Bullish Marubozu is relatively long, indicating a significant price movement during the session.
- No or Tiny Shadows: There are little to no upper or lower shadows, or they are very small compared to the real body.
- Open Near Low, Close Near High: The candlestick opens near the low of the session and closes near the high, highlighting the strong buying pressure from start to finish.
- The pattern is more reliable when it forms after a significant downtrend or at a support level.
- A series of Bullish Marubozu patterns might indicate a sustained bullish momentum.
- Traders often seek confirmation from other technical indicators or patterns before acting on a Bullish Marubozu signal.
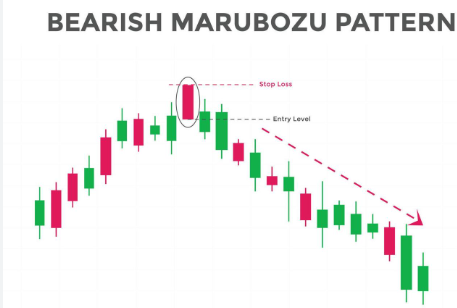
- Long Real Body: The real body of a Bearish Marubozu is relatively long, indicating a significant price movement during the session.
- No or Tiny Shadows: There are little to no upper or lower shadows, or they are very small compared to the real body.
- Open Near High, Close Near Low: The candlestick opens near the high of the session and closes near the low, highlighting the strong selling pressure from start to finish.
- The pattern is more reliable when it forms after a significant uptrend or at a resistance level.
- A series of Bearish Marubozu patterns might indicate a sustained bearish momentum.
- Traders often seek confirmation from other technical indicators or patterns before acting on a Bearish Marubozu signal.
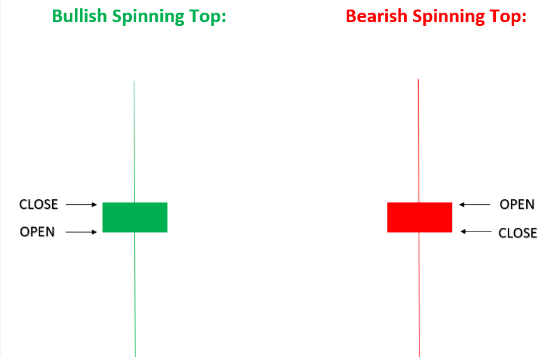
- Small Real Body: The real body of a Spinning Top is small, indicating a narrow range between the open and close prices.
- Long Upper and Lower Shadows: The upper and lower shadows are relatively long, suggesting that prices moved significantly higher and lower during the session.
- Indecision: The pattern indicates a lack of conviction from both buyers and sellers, resulting in a neutral or uncertain market sentiment.
- After a protracted uptrend or downturn, a Spinning Top may indicate a probable reversal, especially if it occurs at a significant level of support or resistance.
- If a trading range reaches a spinning top, the range may continue.
- Before responding on a Spinning Top signal, it is frequently wise to seek confirmation from other technical indications or patterns.
- Spinning Tops in succession could signify a stage of consolidation prior to a potential breakout or breakdown.
- Bearish Candlestick: The first candlestick is a bearish (red or black) candlestick that is relatively long, indicating that the decline will continue.
- Bullish Candlestick: The second candlestick is a bullish (green or white) candlestick that opens below the candle's low and closes above the true body's midway from the previous day.
- The second candlestick's close must penetrate more than halfway into the real body of the first candlestick.
- There can be a small upper shadow on the second candlestick, but ideally, there should be no upper shadow or a very small one.
- The pattern indicates that sellers pushed prices lower during the first candlestick but were met with buying pressure that caused a significant bounce during the second candlestick.
- The reliability of the pattern increases when it appears after a prolonged downtrend.
- Confirmation from other technical indicators or patterns is often sought before acting on a Piercing Pattern signal.
- Traders may also consider factors such as volume and trendlines to strengthen the validity of the pattern.
- While the Piercing Pattern is a bullish signal, traders should consider potential resistance levels and overall market conditions before making trading decisions.
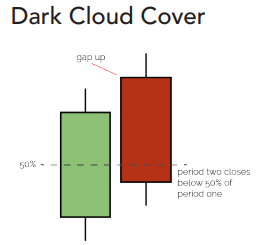
- Bullish Candlestick: The first candlestick is a relatively long bullish (green or white) candlestick, indicating the continuation of the uptrend.
- Bearish Candlestick: The second candlestick is a bearish (red or black) candlestick that opens above the high of the previous day's candle and closes below the midpoint of the previous day's real body.
Important features of a Dark Cloud Cover :
- The second candlestick's close must penetrate more than halfway into the real body of the first candlestick.
- There can be a small lower shadow on the second candlestick, but ideally, there should be no lower shadow or a very small one.
- The pattern indicates that buyers initially pushed prices higher during the first candlestick but were met with selling pressure that caused a significant pullback during the second candlestick.
Interpreting the Dark Cloud Cover:
- When the pattern develops after a sustained rally, its dependability rises.
- Before responding on a Dark Cloud Cover signal, it is frequently wise to look for confirmation from other technical indicators or patterns.
- To support the legitimacy of the pattern, traders may additionally take into account elements like volume and trendlines.
- Even if the Dark Cloud Cover is a bearish indication, traders should take the market's general health and probable support levels into account before placing trades.
2. Timescales: From intraday to weekly charts, candlestick patterns are profitable on a variety of timescales. Patterns should be picked by traders based on their desired timeframe and trading strategy.
3. Risk management: Use effective risk management techniques, such as placing stop-loss orders, to safeguard cash in the event that the anticipated price movement does not occur.
4. Combining Patterns: By combining candlestick patterns with additional technical indicators like moving averages, RSI, and MACD, traders can improve their assessments.









0 Comments
If you have any doubt, please let me know